
 Part of VartaAPI WhatsApp
Reports
WhatsApp reports and analytics
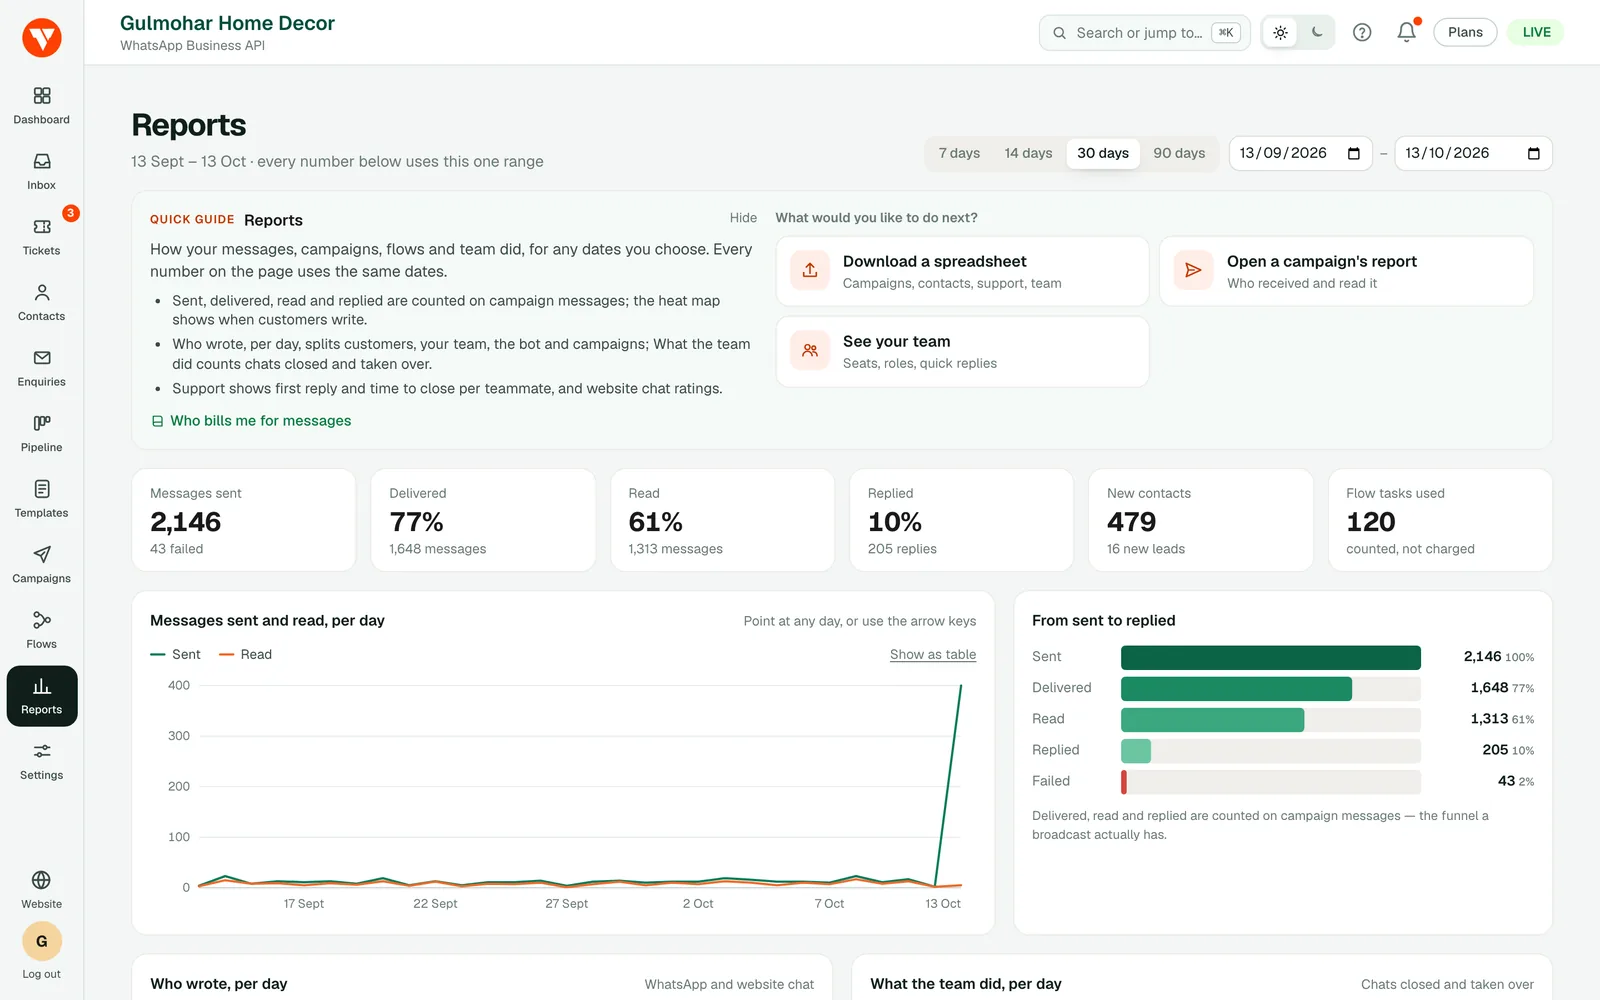
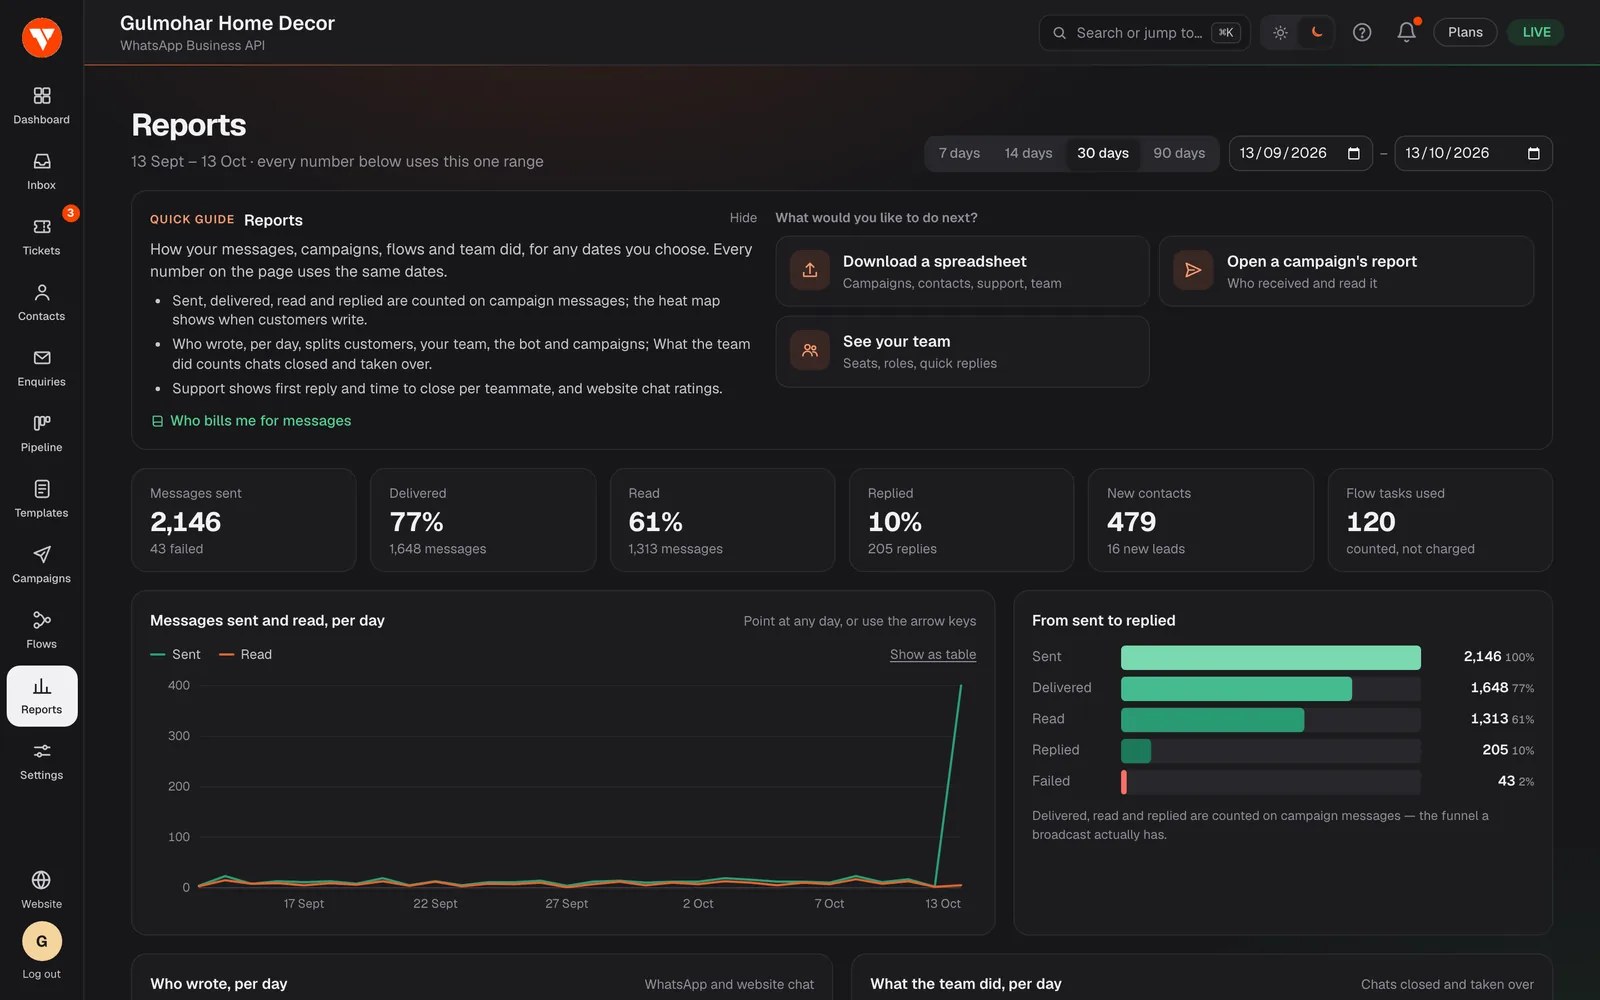
See what you sent, and what it did. One date range drives the whole page — what you sent, what got read, and the hours your customers actually write to you. Every chart can be read as a table, and exported.
One range, whole page
Change the dates once and every number on the screen follows it.
When people write
A week by hour, so the busy times are obvious — useful for rotas and for timing a campaign.
Per-flow results
Runs, finishes and failures for every chatbot flow, with the step that broke.
Reports
Numbers you can act on, not a wall of charts
Sent, delivered, read and replied over time; the campaigns that landed; the flows that ran. Everything on the page can be exported as CSV and opened in a spreadsheet.
- ✓Sent, delivered, read and replied per day
- ✓A 7×24 heatmap of when customers message you
- ✓Per-campaign read and reply counts
- ✓Per-flow runs, finishes and failures
- ✓CSV export on everything
One date range for the whole page
Choose the dates once and every number on the page follows them: messages sent, delivered, read and replied, day by day. Every chart can also be read as a table, and anything can be exported as a CSV file to open in a spreadsheet.
When your customers actually write
A week-by-hour map shows when customers message you, so the busy times are obvious. Use it to plan who is on duty, and to time a campaign for when people are listening.
What your campaigns and chatbots did
See each campaign's read and reply counts beside the others, and for every chatbot flow the runs, the finishes and the failures, with the step that broke. Per-recipient reporting on a campaign shows who received it, who read it and who did not.
Questions
Questions people ask before they start.
What does the WhatsApp reports page show?
Can I export the numbers?
Does it show what Meta charged me?
How fresh are the numbers?
Which plans include reports?
Ready to try it on your own number?
7-day free trial · No credit card required